

Zodiac Sign Statistics: The Most Common and Rarest Signs (62 Million US Births)
Cancer is the most common zodiac sign in the US, at 9.0% of births, and Capricorn is the rarest, at 7.5%. Cancer wins partly because its season is the longest (32 days). Counted per day, Virgo is the busiest sign for births: about 11,989 babies a day, compared with 10,720 a day for Capricorn, whose season includes Christmas and New Year.
Key takeaways
- ·Cancer is the most common sun sign: 9.0% of US births, 5.6 million babies over 15 years (this analysis).
- ·Capricorn is the rarest: 7.5% of births, and the lowest daily birth rate of any sign (this analysis).
- ·Virgo has the highest daily birth rate, 11.8% higher than Capricorn’s (this analysis).
- ·The most common birthday is September 12. Seven of the ten most common birthdays fall between September 10 and 26, in Virgo and early Libra season (this analysis).
- ·The least common birthday is December 25, with 49.4% fewer births than September 12 (this analysis).
- ·February 29 is the rarest birthday overall: it only exists once every four years, and it still ranks 351st of 366 dates when it does (this analysis).
- ·30% of US adults consult astrology, tarot or a fortune teller at least once a year (Pew Research Center, 2025).
What is the most common zodiac sign?
Cancer is the most common zodiac sign by total births, and Virgo is the most common per day of its season.
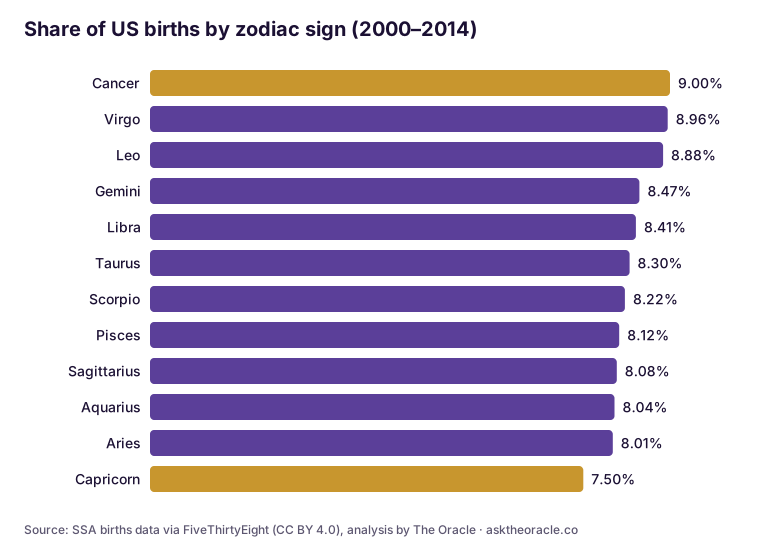
- ·9.00% of US births were Cancers (June 21 – July 22), the largest share of any sign (this analysis).
- ·8.96% were Virgos and 8.88% Leos. The three late-summer signs together account for more than a quarter of all births (this analysis).
- ·Sign seasons differ in length, from 29 days (Capricorn) to 32 days (Cancer), which explains part of the gap (this analysis).
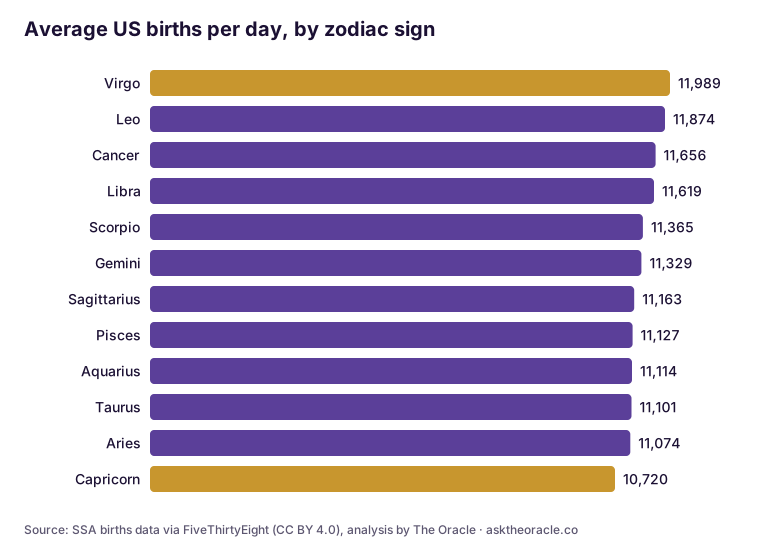
- ·11,989 babies a day are born under Virgo (August 23 – September 22), the highest daily rate of any sign (this analysis).
- ·September has the highest daily birth rate of any month, 10.0% above January (this analysis).
What is the rarest zodiac sign?
Capricorn is the rarest zodiac sign: it has the smallest share of births (7.5%) and the fewest births per day (10,720).
| Holiday in Capricorn season | Average births | Rank of 366 dates |
|---|---|---|
| December 25 | 6,438 | 366 (least common) |
| January 1 | 7,735 | 365 |
| December 24 | 8,034 | 364 |
| January 2 | 9,606 | 362 |
| December 26 | 9,874 | 361 |
- ·Capricorn season (December 22 – January 19) covers Christmas Eve, Christmas Day, Boxing Day, New Year's Day and January 2. All five are among the 10 least common birthdays in the US (this analysis).
- ·In US hospital data, births fall 18% on the day of and just after a holiday (Jacobson, Kogelnik & Royer, NBER, 2020).
- ·Roughly half of that holiday dip comes from fewer caesarean sections, and the “missing” births move into a window from 11 days before to 16 days after the holiday (NBER, 2020).
Zodiac signs ranked by number of births
| Rank | Sign | Dates | Days | Share of births | Births per day |
|---|---|---|---|---|---|
| 1 | Cancer | Jun 21 – Jul 22 | 32 | 9.00% | 11,656 |
| 2 | Virgo | Aug 23 – Sep 22 | 31 | 8.96% | 11,989 |
| 3 | Leo | Jul 23 – Aug 22 | 31 | 8.88% | 11,874 |
| 4 | Gemini | May 21 – Jun 20 | 31 | 8.47% | 11,329 |
| 5 | Libra | Sep 23 – Oct 22 | 30 | 8.41% | 11,619 |
| 6 | Taurus | Apr 20 – May 20 | 31 | 8.30% | 11,101 |
| 7 | Scorpio | Oct 23 – Nov 21 | 30 | 8.22% | 11,365 |
| 8 | Pisces | Feb 19 – Mar 20 | 30 (31 in leap years) | 8.12% | 11,127 |
| 9 | Sagittarius | Nov 22 – Dec 21 | 30 | 8.08% | 11,163 |
| 10 | Aquarius | Jan 20 – Feb 18 | 30 | 8.04% | 11,114 |
| 11 | Aries | Mar 21 – Apr 19 | 30 | 8.01% | 11,074 |
| 12 | Capricorn | Dec 22 – Jan 19 | 29 | 7.50% | 10,720 |
What are the most and least common birthdays?
September 12 is the most common birthday in the US, and December 25 is the least common (leaving aside February 29, which only exists one year in four).
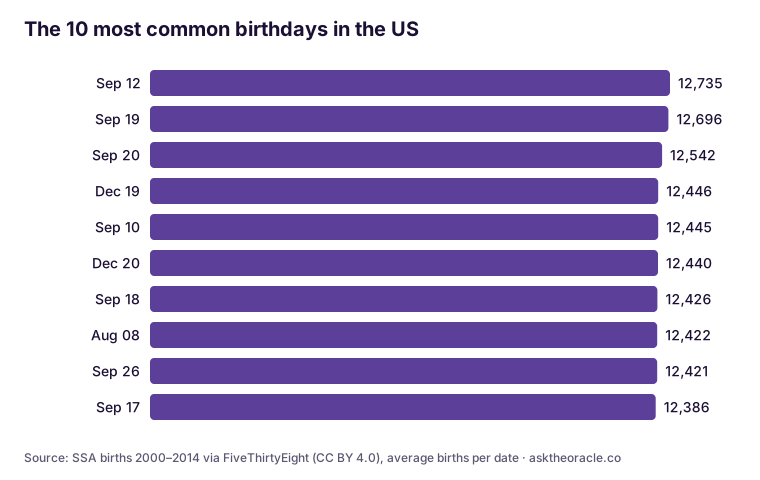
- ·12,735 babies are born on an average September 12, the highest of any date (this analysis).
- ·7 of the 10 most common birthdays fall between September 10 and September 26, in Virgo and early Libra season. The other three are December 19 and 20 (just before Christmas) and August 8 (this analysis).
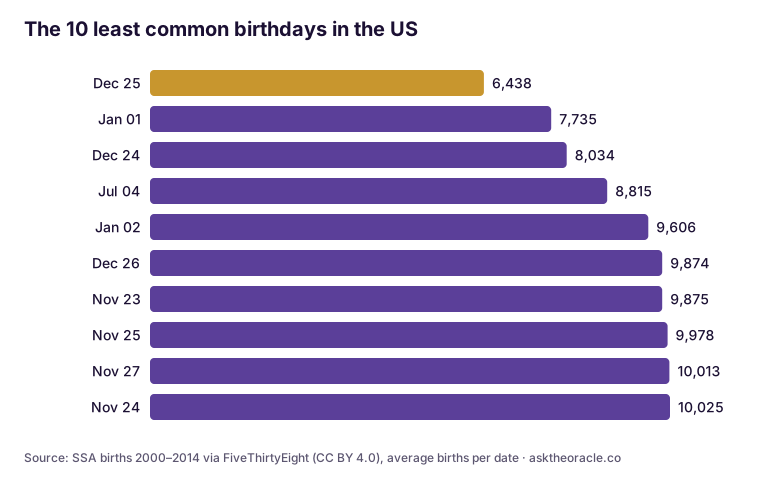
- ·6,438 babies are born on an average Christmas Day, about half the September 12 figure (this analysis).
- ·January 1, December 24, July 4 and January 2 are the next least common birthdays, all of them holidays or next to one (this analysis).
Do holidays and superstitions change when babies are born?
Yes. Scheduled births avoid holidays, weekends and even Friday the 13th.
| Day | Average births | Compared with |
|---|---|---|
| Tuesday | 13,122 | the busiest weekday |
| Sunday | 7,518 | 42.7% fewer than Tuesday |
| Friday the 13th | 11,950 | 6.4% fewer than other Fridays (the 6th and 20th) |
| Valentine's Day (Feb 14) | 11,999 | ranks 48th of 366 dates |
| Halloween (Oct 31) | 10,263 | ranks 356th of 366 dates |
| April Fools' Day (Apr 1) | 10,316 | ranks 355th of 366 dates |
- ·42.7% fewer babies are born on Sundays than on Tuesdays, which points to scheduled inductions and caesareans (this analysis).
- ·The holiday dip is consistent with US hospital research, which finds 18% fewer births on and just after holidays (NBER, 2020).
How many people follow astrology?
About three in ten US adults consult astrology, tarot or a fortune teller every year. Most say it's for fun.
| Practice (US adults, at least once a year) | Share | Source |
|---|---|---|
| Astrology, tarot or a fortune teller (any) | 30% | Pew, 2025 |
| Astrology or a horoscope | 28% | Pew, 2025 |
| Tarot cards | about 1 in 10 | Pew, 2025 |
| Fortune teller | 6% | Pew, 2025 |
- ·20% of US adults say they do at least one of these mostly just for fun (Pew Research Center, 2025).
- ·Pew surveyed 9,593 US adults from October 21 to 27, 2024 (Pew Research Center, 2025).
- ·The US recorded 3,628,934 births in 2024 (CDC National Center for Health Statistics). At the 2000–2014 shares, that’s roughly 326,000 Cancers and 272,000 Capricorns born in a single year (this analysis).
Curious what your own sign says beyond the birth statistics? Find it with the zodiac sign calculator, or read your full birth chart.
Methodology
- ·Data: daily US birth counts from the Social Security Administration for January 1, 2000 to December 31, 2014 (5,479 days, 62,187,024 births), as published by FiveThirtyEight (dataset, CC BY 4.0 licence).
- ·Zodiac signs: tropical sun-sign dates as used across The Oracle (zodiac signs). The exact change-over day can shift by one day depending on the year and time of birth. This analysis assigns each calendar date to one sign, as most date tables do.
- ·Shares are each sign’s births divided by all births. Births per day divide each sign’s births by the number of calendar days in its season across the 15 years, which removes the effect of seasons having different lengths.
- ·Birthdays: the average number of births on each calendar date across the years it occurred. February 29 occurred 4 times (2000, 2004, 2008, 2012).
- ·Population estimates apply the 2000–2014 shares to the CDC’s 2024 birth total. They’re illustrative, not counts.
- ·The calculations are reproducible from the dataset. The full results (all 12 signs, all 366 birthdays, months and weekdays) and the script that reproduces them are published on Zenodo under CC BY 4.0: doi.org/10.5281/zenodo.24358958.
How to cite this page
The Oracle. “Zodiac Sign Statistics: The Most Common and Rarest Signs (62 Million US Births).” asktheoracle.co, November 2026. https://www.asktheoracle.co/insights/data/zodiac-sign-statistics
Dataset: The Oracle: Mystic Companion (2026). US births by zodiac sign and birthday, 2000–2014 (Version 1.0) [Data set]. Zenodo. https://doi.org/10.5281/zenodo.24358958
Journalists and bloggers are welcome to use the charts on this page with a link back to it.
Sources
- Social Security Administration births data, 2000–2014, published by FiveThirtyEight. https://github.com/fivethirtyeight/data/tree/master/births (licence: https://github.com/fivethirtyeight/data/blob/master/LICENSE)
- Pew Research Center. “30% of Americans Consult Astrology, Tarot Cards or Fortune Tellers.” May 21, 2025. https://www.pewresearch.org/religion/2025/05/21/3-in-10-americans-consult-astrology-tarot-cards-or-fortune-tellers/ (full report PDF: https://www.pewresearch.org/wp-content/uploads/sites/20/2025/05/PR_2025.05.21_astrology-tarot-cards-fortune-tellers_report.pdf)
- Jacobson, M., Kogelnik, M. & Royer, H. “Holiday, Just One Day Out of Life: Birth Timing and Post-natal Outcomes.” NBER Working Paper 27326, 2020; Journal of Labor Economics, 2021. https://www.nber.org/papers/w27326
- CDC National Center for Health Statistics. “FastStats: Births and Natality” (2024 data). https://www.cdc.gov/nchs/fastats/births.htm
Changelog
- ·2026-11-21: Corrected the count of top-10 birthdays falling in September (7, not 9).
- ·2026-11-19: Added the Zenodo dataset and DOI.
- ·2026-11-16: First published.